
task 1
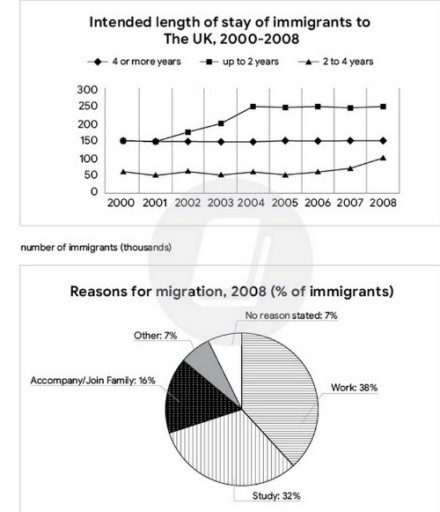
The graph and chart below give information about migration to the UK. The graph below shows how long immigrants in the year 2000-2008 intended to stay in the UK. And the pie-chart shows reasons for migration in 2008.
Summarise the information by selecting and reporting the main features, and make comparisons where relevant.
task 2
It is important for all towns and cities to have large public spaces such as parks and squares. Do you agree or disagree with this statement?