
task 1
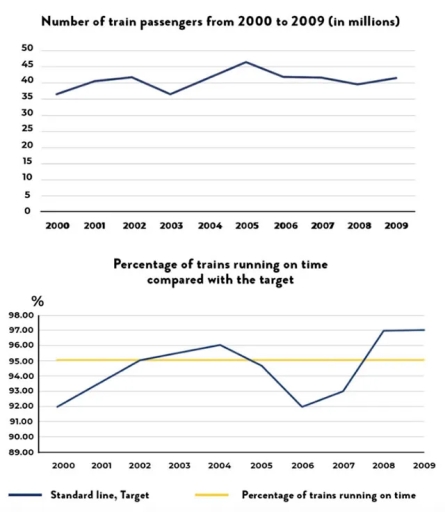
The first graph shows the number of train passengers from 2000 to 2009. The second graph shows the percentage of trains running on time.
Summarise the information by selecting and reporting the main features and make comparisons where relevant.
task 2
Some people say that it is impossible to live comfortably in big cities. What problems are faced by the people living in big cities? What steps can be taken to solve those problems?